v1.3.0labctl is out

Practise production
without the production.

SnowOps Labs stands up a production-shaped Kubernetes cluster on your laptop in minutes, breaks it in realistic ways, and grades you on how you fix it. Real Prometheus, real Istio, real failures.

For engineers who passed the CKA and still freeze when the pager goes off.

Runs on
macOS · Linux · WSL2
Licence
Apache-2.0
Cloud account
Not required
labctl — the four loops
Scenarios
13
Injectable faults
6
Timed challenges
3
Platform components
21
Runtimes
3
The core mechanic

Four loops, one binary

Build a realistic platform, run a scenario against it, break it on purpose, and measure how you did. Everything else in the project exists to serve these four.

Loop 1 of 4

Stand up a production-shaped cluster

A local k3d cluster plus a real platform stack from swappable providers — ingress, metrics, logs, traces, GitOps, mesh, secrets, autoscaling. Actual Prometheus and actual Istio, at laptop scale.

  • 3-node k3d cluster in minutes
  • Swap Traefik ↔ Nginx, Istio ↔ Linkerd
  • kubectl / helm / k3d installed for you
run it
labctl init
Try it right here

The incident room

Every fault below is real content from the repo — the same symptom, the same progressive hints, the same scoring. Start the clock and see how far you get before you need help.

Fault library
Standing bybad-deploy-rollout
MTTR00:00
Hints0/3
Score100
Medium severityWorkload

Bad deploy: image that doesn't exist

What you are told

A release went out referencing an image tag that was never pushed. The rollout is stuck — new pods sit in ImagePullBackOff while the old version keeps serving.

This is a dry run of the loop, not a live cluster. The real thing injects the fault into actual running systems and a machine check decides whether you fixed it.

The content

A curriculum that already exists as software

Declarative scenarios with machine-verifiable checks, reversible faults with progressive hints, and timed challenges with par times — all of it version-controlled alongside the engine.

13 scenarios

Scenarios

  • ScalabilityVerified

    Autoscaling Under Load

    Watch KEDA scale go-api on Prometheus RPS: a spike drives it from 1 to several replicas, then cooldown brings it back. The flagship 'autoscaling actually works' demo, verified under traffic from the load generator.

    labctl scenario up autoscaling-under-load1 stageSource
  • ReliabilityVerified

    Chaos Engineering

    Run the chaos engineering loop against go-api with Chaos Mesh: establish a steady state under load, form a hypothesis, inject a failure — pod kill, network delay, CPU and memory stress — and measure the blast radius on a Grafana dashboard. go-api ships as a single replica behind a PodDisruptionBudget, so it starts out with disruptionsAllowed=0: a node drain would block forever while a pod kill is still a full outage. Your job is to find that with an experiment and fix it, then prove the same experiment no longer hurts.

    labctl scenario up chaos-engineeringSource
  • CostVerified

    Cost & Capacity: Right-Sizing Over-Provisioned Resources

    Deploy go-api with deliberately over-provisioned CPU and memory requests, observe the inflated cost in OpenCost, then right-size the requests to a realistic baseline. Checks verify that requests were reduced to the target thresholds while go-api stays healthy under traffic. Teaches the observe-measure-reduce loop that keeps platform costs rational.

    labctl scenario up cost-right-sizing1 stageSource
  • OperationsVerified

    Day-2 Drill: Namespace Backup & Restore

    Back up a namespace's resources to a manifest archive, simulate accidental data loss (delete a resource — or the whole namespace), then restore from the backup and verify the round-trip with checks. A stateful data-writer on a PersistentVolume makes the crucial lesson concrete: the manifest backup round-trips Kubernetes OBJECTS, not the DATA on a volume. A dependency-light alternative to Velero that teaches the backup/restore loop every operator must rehearse before they need it.

    labctl scenario up backup-restore-drill2 stagesSource
  • Operations

    Day-2 Drill: Node Drain Under Load

    Cordon and drain a worker node while go-api serves live traffic. A PodDisruptionBudget keeps a minimum number of replicas available, so the scheduler reschedules pods onto the remaining nodes without dropping requests. The grade is the measured request success rate through the drain.

    labctl scenario up node-drain-drill1 stageSource
  • Operations

    Day-2 Drill: Rolling Cluster Upgrade Under Load

    Roll the cluster's worker nodes onto a new Kubernetes version one at a time while go-api serves live traffic. You write the PodDisruptionBudget, you cordon and drain each node, and you watch the PDB block the eviction that would have taken the app down. The grade is the measured request success rate across the upgrade window and a cluster left with no node behind.

    labctl scenario up cluster-upgrade-drill1 stageSource
  • DataVerified

    Event-Driven Architecture

    A producer/consumer flow through Kafka (Strimzi): an 'orders' topic with a continuous producer and a consumer group. Stage 2 ramps producers to build consumer lag — observe it, then scale consumers (manually or with KEDA's Kafka scaler) to drain it.

    labctl scenario up event-driven-arch2 stagesSource
  • DeliveryVerified

    GitOps & CI/CD (ArgoCD)

    Run a real GitOps loop against a Git repository you can actually push to. The lab serves its own repo in-cluster; ArgoCD reconciles it. You clone it, change the declared image and replica count, push, and watch the cluster follow — then prove the two halves of the contract that make GitOps different from kubectl: self-heal reverts a change you make by hand, and prune deletes a resource you remove from Git.

    labctl scenario up gitops-cicd4 stagesSource
  • NetworkingVerified

    Mesh Traffic Management

    Istio canary release for go-api: a 90/10 weighted split between v1 and v2, mesh-level latency fault injection, and STRICT mTLS on the canary workload. Watch the split and faults in mesh telemetry.

    labctl scenario up mesh-traffic-management2 stagesSource
  • DeliveryVerified

    Multi-Env Promotion (Dev → Staging → Prod)

    Run a real release pipeline by hand: build versioned go-api images, deploy one to dev, and promote it forward to staging then prod with plain kubectl. Promotion here is a genuine image rollout (new ReplicaSet), not a ConfigMap edit — you build vNEXT, roll it out per environment, and watch each env's /version change as the release moves down the pipeline.

    labctl scenario up env-promotion4 stagesSource
  • ObservabilityVerified

    Observability & SRE

    Full observability stack with log aggregation, distributed tracing, alerting rules, and SLO dashboards.

    labctl scenario up observability-sre3 stagesSource
  • SecurityVerified

    Secrets Management & Rotation

    A workload mounts a Vault-backed secret that External Secrets keeps in sync. You rotate the value in Vault; it must reach the running pod through ESO and the kubelet with no restart and no redeploy. The grade is what the running container reads from disk.

    labctl scenario up secrets-management1 stageSource
  • SecurityVerified

    Security & Compliance (Audit → Enforce)

    Take a cluster from 'policies exist' to 'policies bite'. Kyverno ships four Pod Security and best-practice ClusterPolicies in Audit mode, so nothing is blocked and every violation lands in a policy report. Your job is the part a real team owns: read the report, remediate the workload at the source, promote the policies to Enforce, prove the admission webhook now rejects a non-compliant Pod, and issue a real TLS certificate from the lab CA with cert-manager — on a namespace that is default-deny in both directions.

    labctl scenario up security-compliance4 stagesSource
No toy clusters

Everything you install is the real thing

Actual Prometheus. Actual Istio. Actual Kafka. Failures are injected into real systems, so the dashboards you learn to read are the dashboards you already have at work.

  • _lib

  • autoscaling

    KEDA

  • chaos

    Chaos Mesh

  • cost

    OpenCost

  • dashboard

    Dashboard

  • data

    KafkaPostgreSQL

  • gitops

    ArgoCD

  • ingress

    NginxTraefik

  • logging

    Loki

  • mesh

    IstioLinkerd

  • monitoring

    GrafanaPrometheus

  • secrets

    External secretsVault

  • security

    Network policiesPolicySecretsTls

  • tracing

    Tempo

Categories marked with a slash are exclusive — you pick one ingress, one mesh — which is exactly the evaluation a platform team has to make. Swap the provider, re-run the scenario, compare with evidence instead of opinion.

One binary, batteries included

Drive it from the terminal or the browser

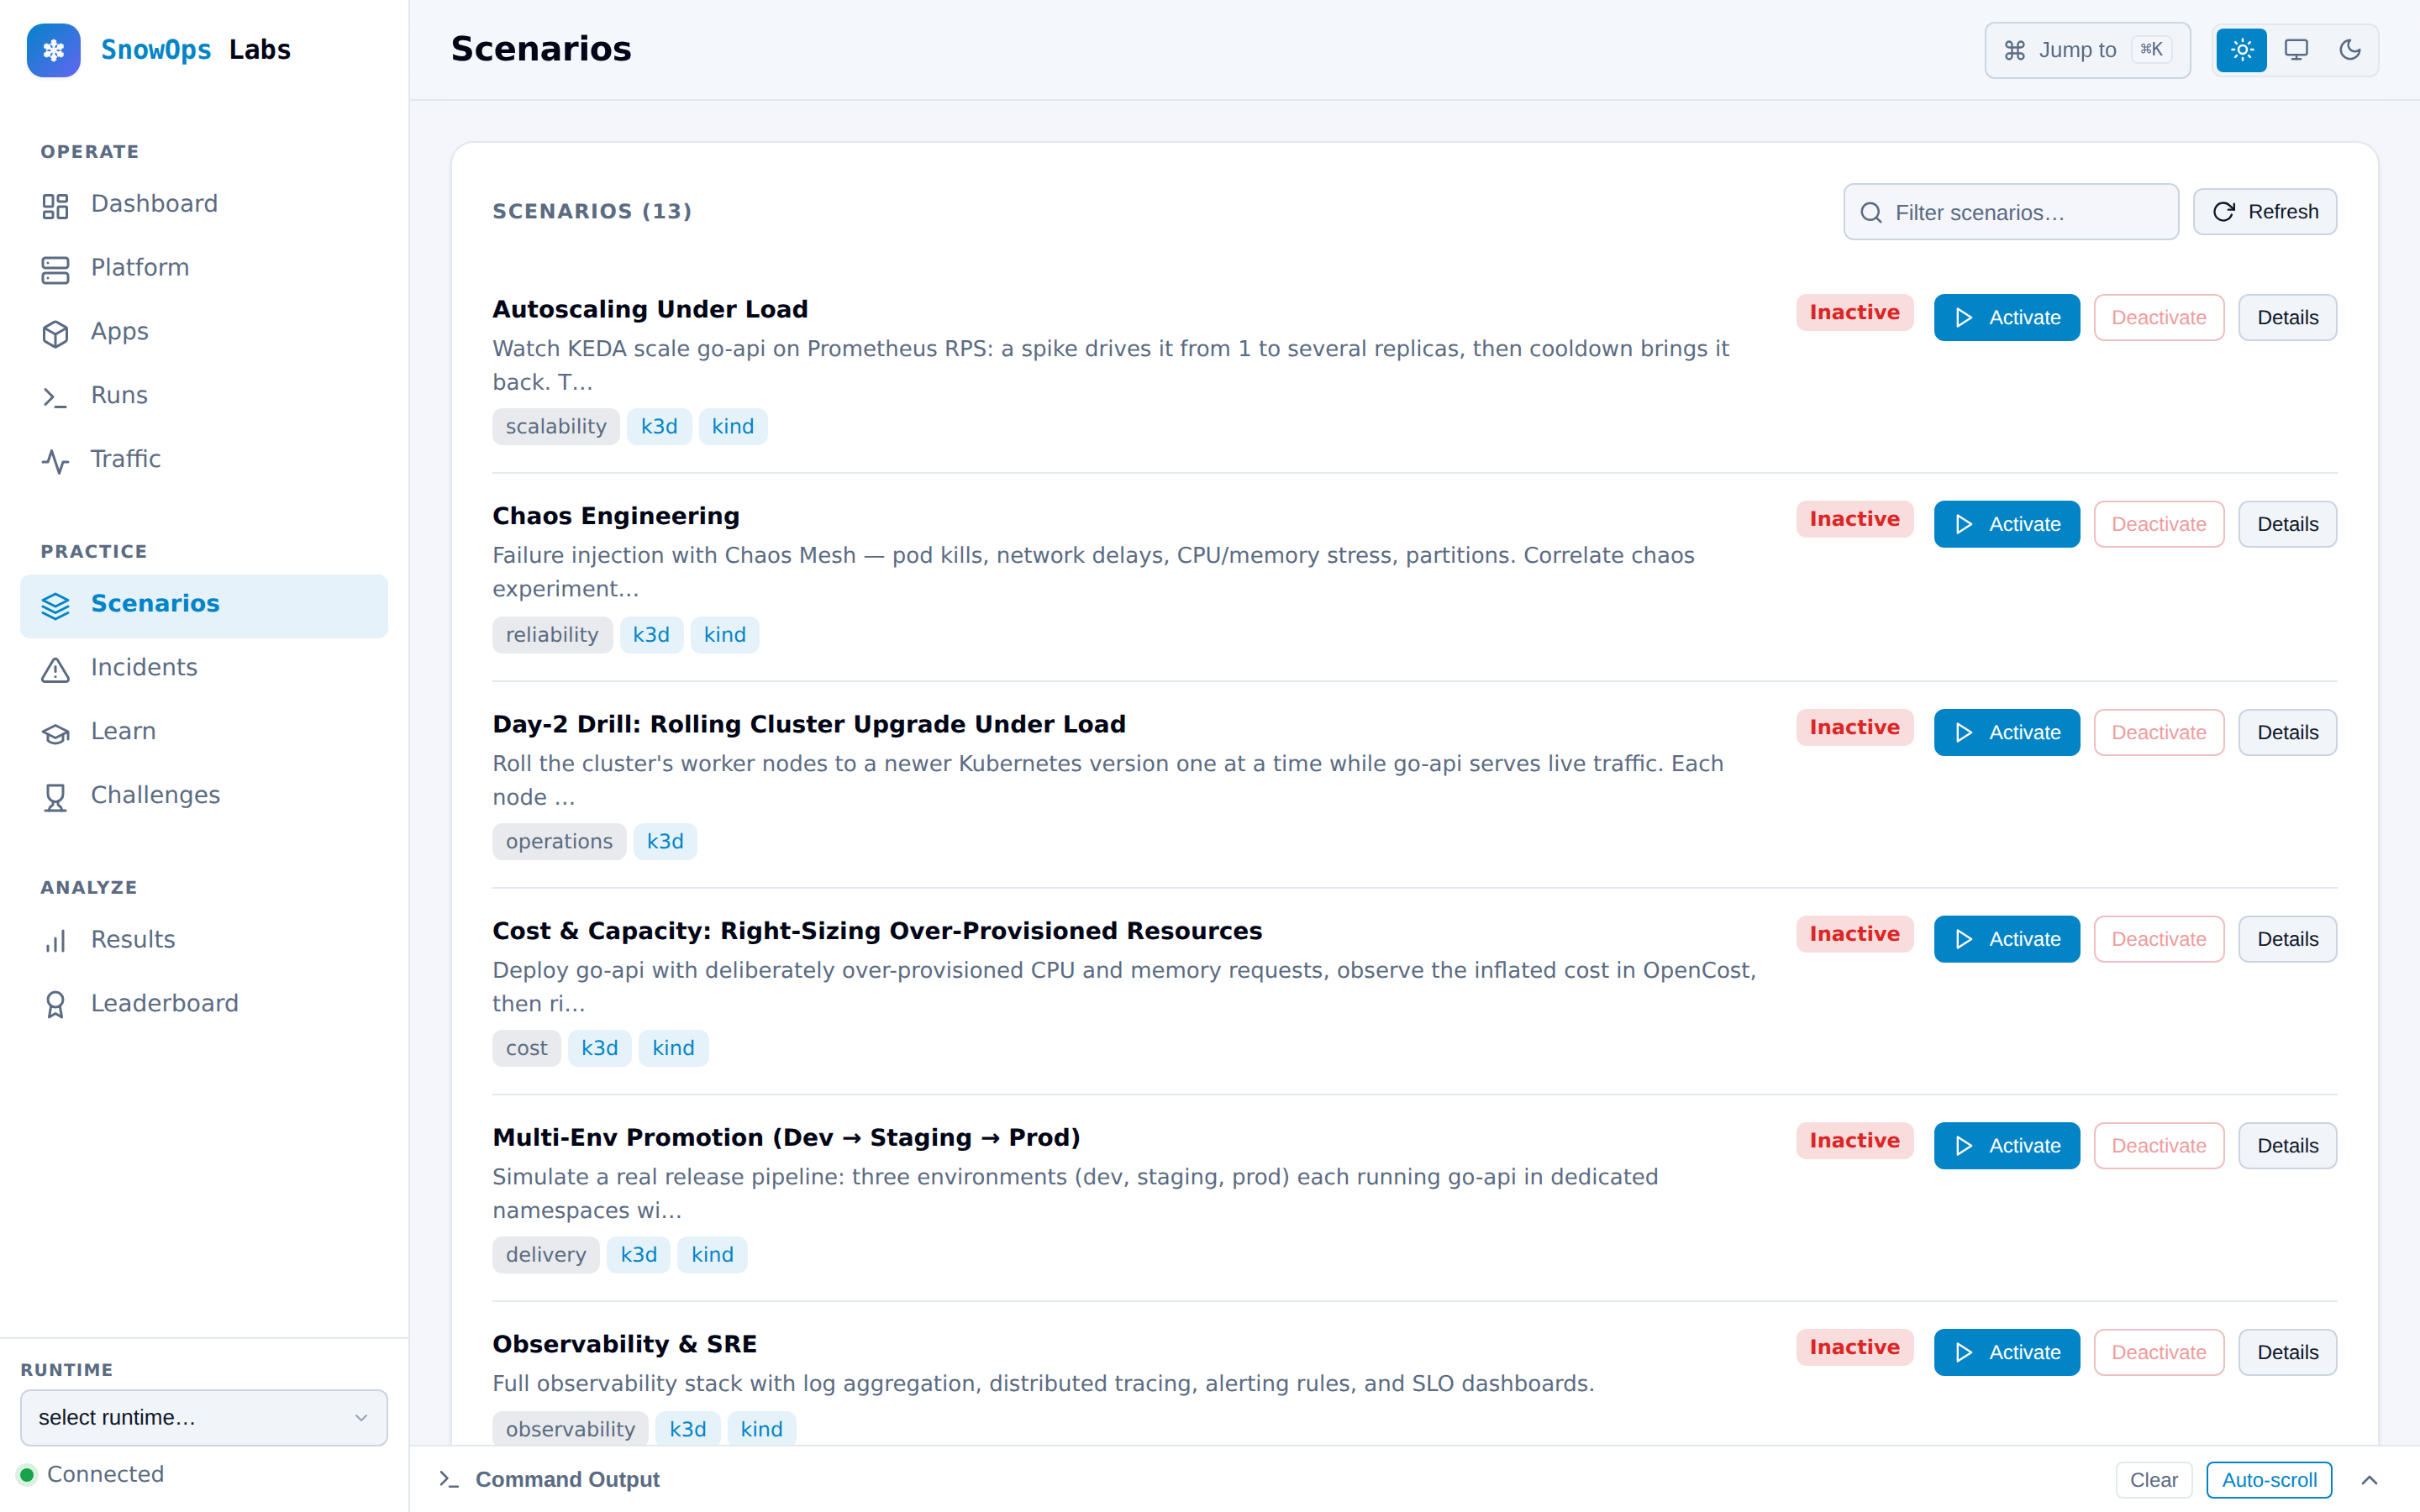
labctl ui serves an embedded dashboard at localhost:3939 — no extra install, no separate service — and it follows your system light/dark theme.

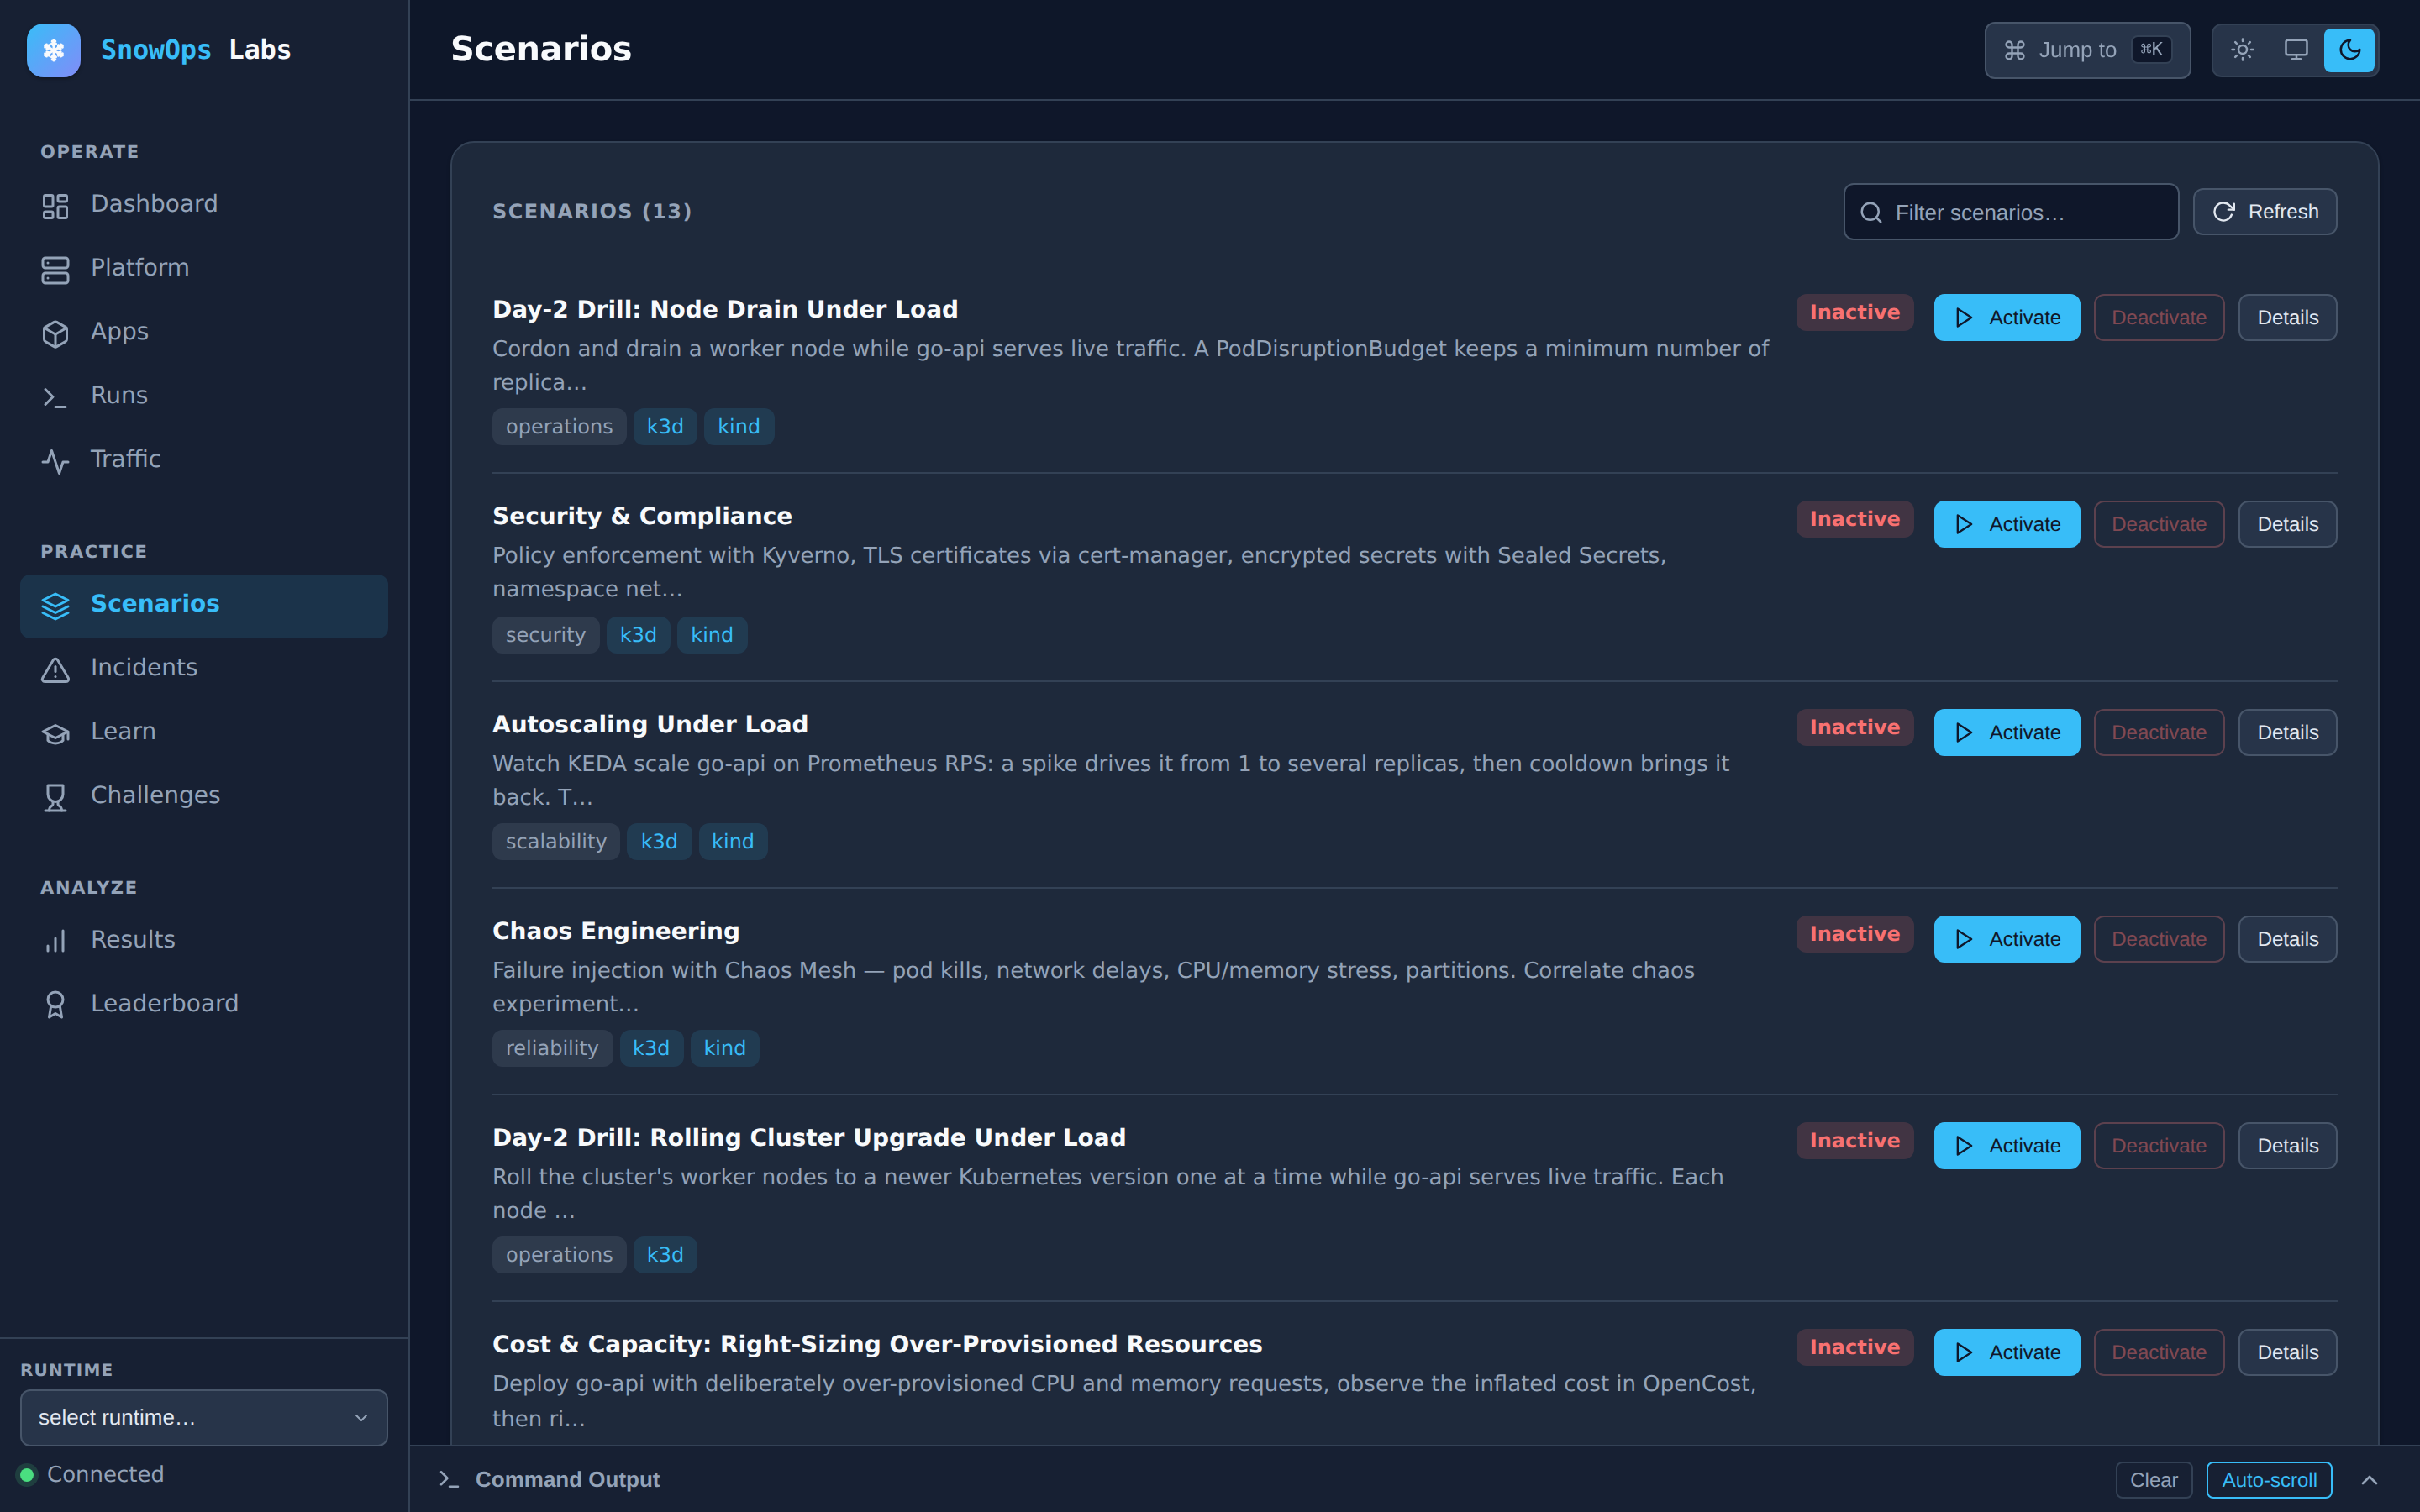
The SnowOps Labs web dashboard showing the scenario catalog, with category tags and one-click activation.The SnowOps Labs web dashboard showing the scenario catalog, with category tags and one-click activation.
The scenario catalog in the embedded dashboard — real output, not a mockup.
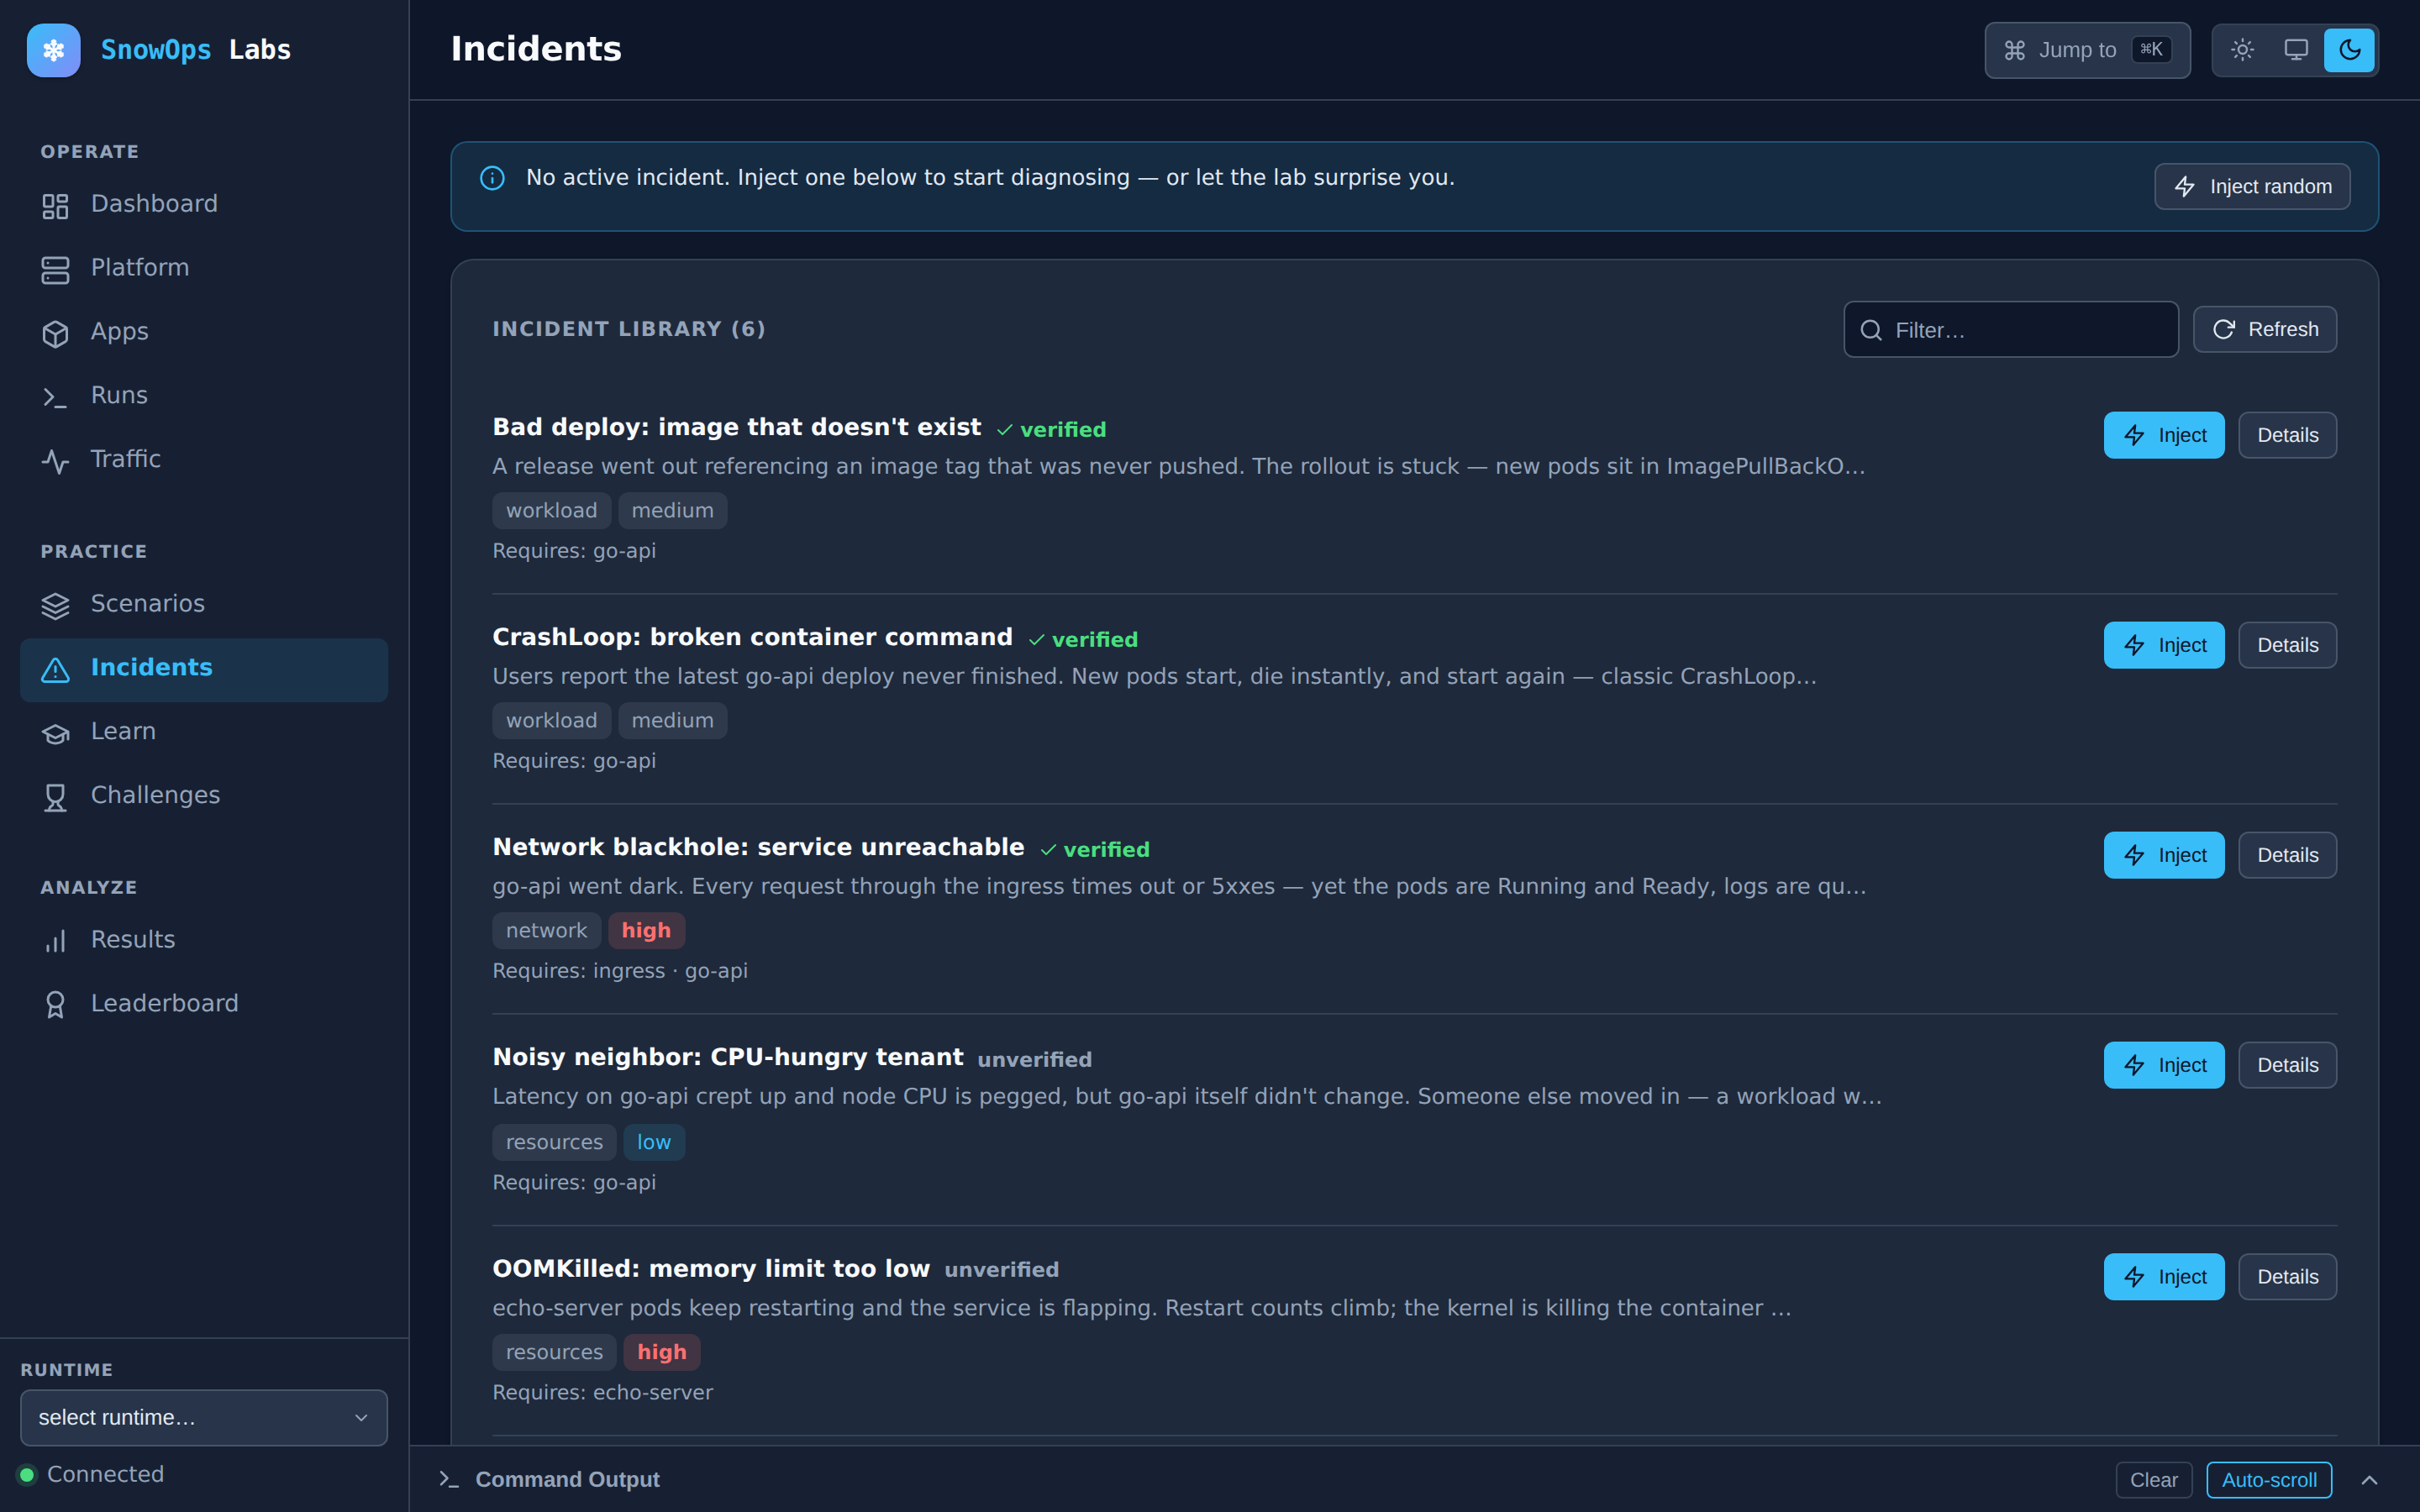
  • The labctl incident library: reversible faults listed with severity and verified badges.
    Fault library
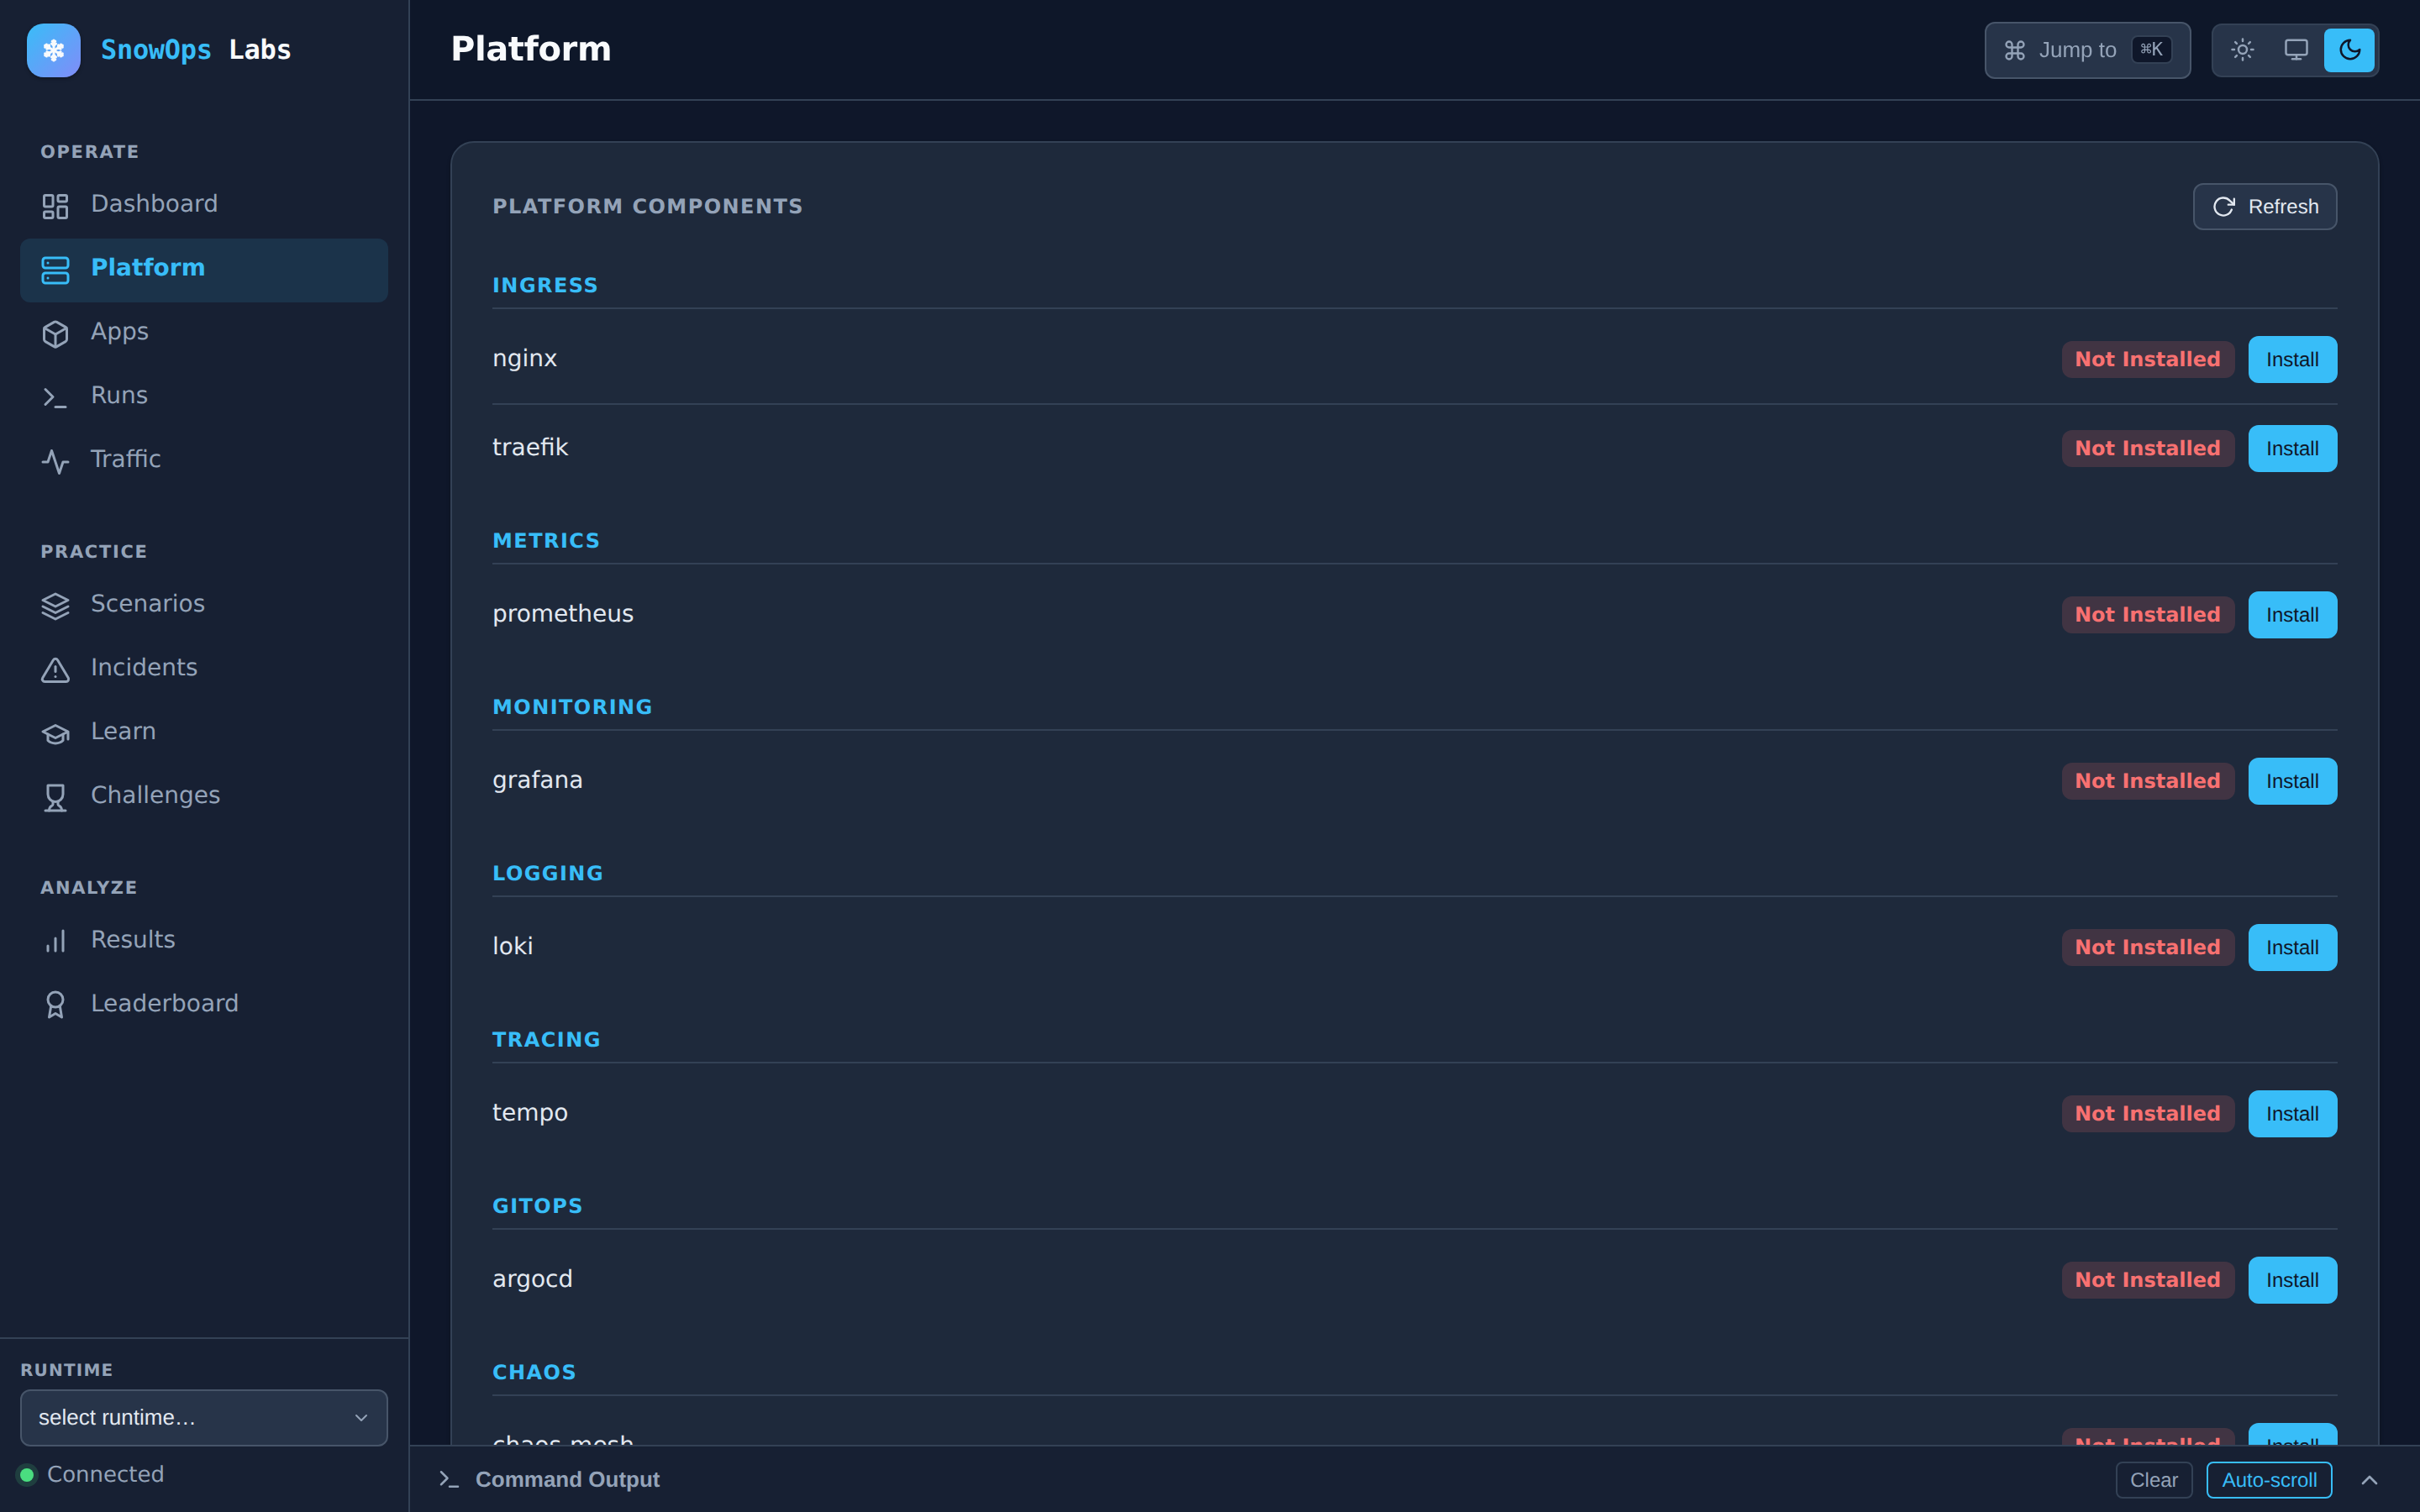
  • Platform components grouped by category, each installable with one click.
    Platform components
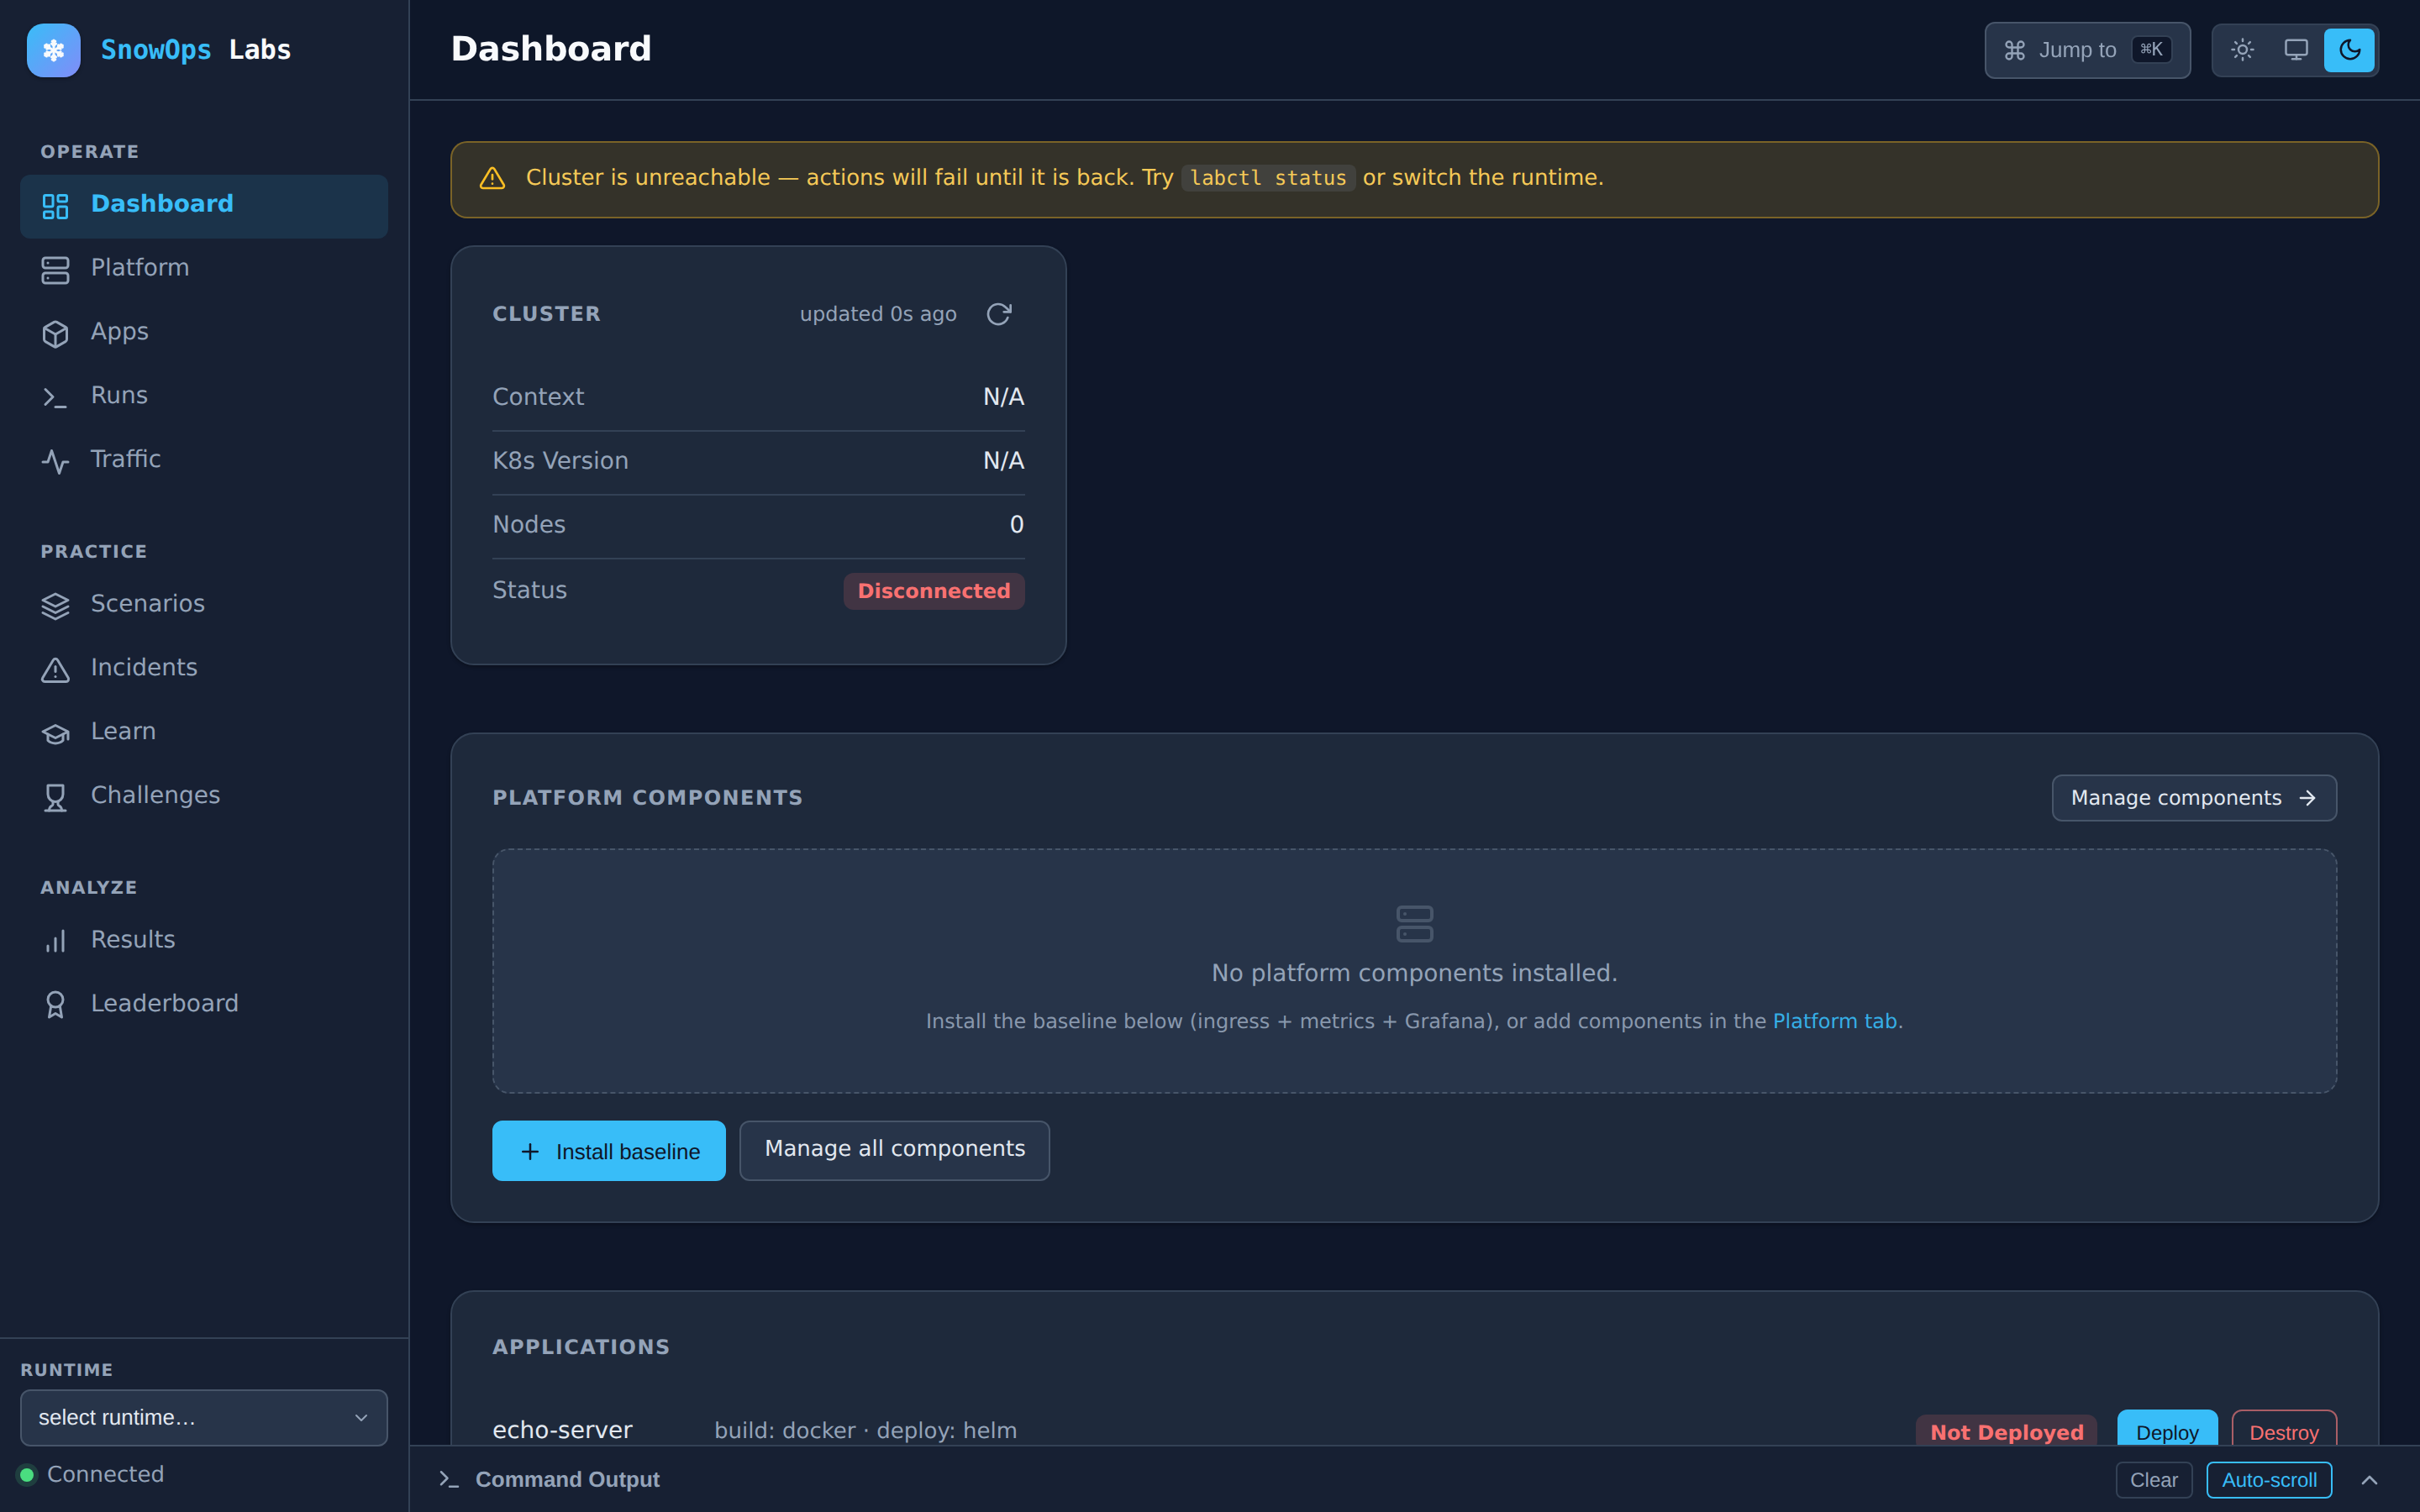
  • The dashboard showing cluster status, platform components and app controls.
    Operate hub
Who it is for

Four people, four loops

Production is the only place these skills get exercised, and production is the worst possible classroom.

  • The engineer levelling up

    Learn → scenario → incident

    Completes a path and can debug that whole class of failure unaided.

  • The platform team evaluating

    Build → swap provider → compare

    Picks Istio over Linkerd with evidence, in a day rather than a month.

  • The SRE running a game day

    Break → measure

    The team's MTTR drops measurably across sessions.

  • The lead assessing skills

    Challenge → leaderboard

    Objective, reproducible signal on incident-response ability.

Open source, Apache-2.0

Anyone who can write YAML can contribute

Go orchestrates, records and grades — it never encodes the content itself. That is a deliberate design principle, and it is what makes the contribution surface small.

  • Write a scenario

    Scenarios, incidents, paths and checks are YAML plus shell scripts. If you can write YAML, you can author for SnowOps Labs — no Go required.

    Your first scenario
  • Pick up an issue

    Good first issues are labelled. The PR bar and the golden rules are written down, so there is no guessing what review will ask for.

    Good first issues
  • Improve the docs

    Docs live next to the code and this site renders them directly. Fix a line in the repo and it shows up here on the next build.

    Contributing guide
  • Tell us what broke

    Early release, rapid iteration, the odd rough edge. A precise bug report with labctl doctor output is worth a great deal.

    Open an issue

Your next incident should not be your first one.

Free, open source, and running on your laptop in the time it takes to read the quickstart.

check your machine first
labctl doctor

One prerequisite worth knowing before you start: Docker needs at least 4 CPUs and 8 GB of memory. The 2 GB a fresh Docker VM ships with is not enough — labctl doctor checks this and prints the fix for your platform.

The incident field notes

One real Kubernetes failure a week — the symptom, the commands that found it, and the fix. Written from actual lab runs, not from memory.

You'll get the Kubernetes Incident Response Field Guide, plus occasional emails about new scenarios, posts and paid offerings such as courses and workshops. Unsubscribe any time.